Sunspots are dark areas on the solar
surface, which were created by the suns magnetic field.
The magnetic field within a Sunspot can be several
thousand times stronger than the magnetic field of the
earth. They are typically 2000 degrees cooler than
their surrounding areas and the extent of a sunspot
can be several times the size of the earth.
The Sunspot Number is a measure of the amount of sun-
spots on the sun at any given point of time. When the
Sunspot Number is plotted as a function of time, one
can clearly see an 11 year cycle in the data. This is
known as the solar cycle and is one of the most important
characteristics of the suns magnetic activity.
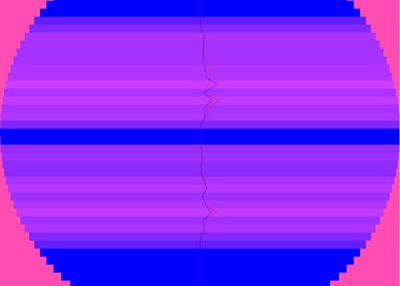
By adding the position of the Sunspots to the plot,
one obtains a so called butterfly diagram. This shows
how the Sunspots migrate towards the equator as the
solar cycle progresses.
The exact origin of the sunspots and the appearance
of their magnetic field is still one of the biggest
mysteries in sun research, and is yet to be explained.
Daily Sunspot Numbers are provided by the National
Geophysical Data Center,
http://www.ngdc.noaa.gov/.
The Butterfly diagram data provided by Dr. David Hataway,
can be found at
http://science.nasa.gov/ssl/pad/solar/greenwch.htm
Visualization:
The middle image on the left shows the butterflydiagram
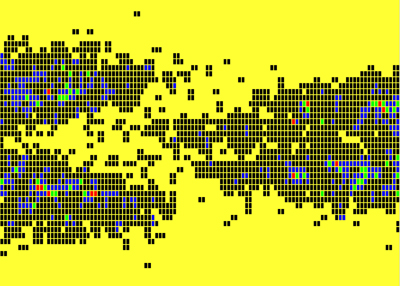
mentioned above. The other images above and below show
the number of Sunspots in 50 so called bins during one
solar rotation. The population of spots in the bins
is either coded in colour or indicated by the size of
the bars.
Sonification:
The 50 bins of the Sunspots are identified with the
keys of a piano. The lowest tone corresponds with the
South Pole. Within one measurement period of one solar
rotation the keys are played sequentially with a volume
proportional to the number of spots.
|